 WhatRoute HelpWhatRoute Help
WhatRoute provides two means of monitoring the bandwidth usage of network interfaces. There is a simple monitor that can be displayed in the system menubar and also a more detailed monitor that will plot a graph of usage over a time period (default 1 hour).
Menubar Monitor
The system menubar monitor can be enabled/disabled in WhatRoute Preferences
Bandwidth Monitor Window
Open the Bandwidth Monitor window by selecting the menu command
Window/Bandwidth. WhatRoute will remember the size and location
of the window and re-open it next time the application is run.
If Resume monitors … is
checked, WhatRoute will immediately begin collecting and displaying data
for the selected interface. Otherwise, click the Start
button.
Toolbar
The window toolbar has controls for Bandwidth window settings and a
pulldown menu to give quick access to commands.
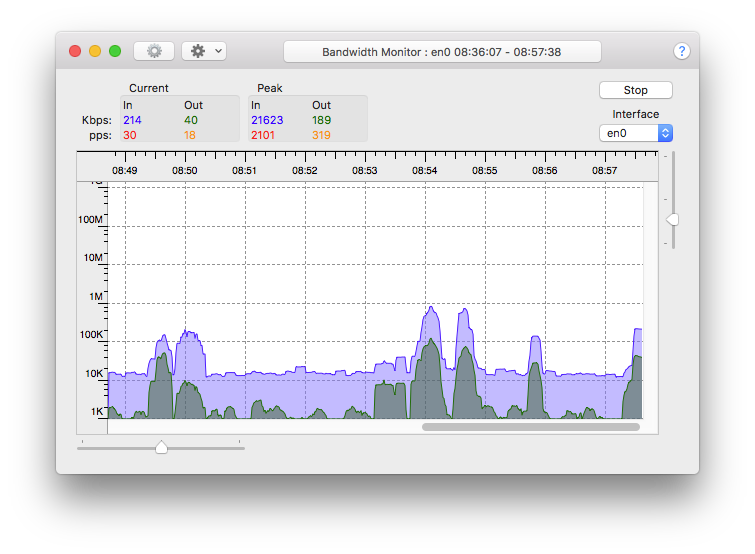
Window Header
The window header displays the current and peak, input and output data
and packet rates. Data rates are always measured in kbps (1000 bits per
second) and packet rates are measured in pps (packets per second).
The measured interface is selectable from a pulldown menu. You can change this selection while the monitor is running.
Monitoring can be stopped/started with the button on the top right of the window.
The Graph
The graph plots data vs time of day. The data rate by default is shown
in a logarithmic scale. Plotting a linear scale is also possible from a
selector in Bandwidth window
settings.
At the bottom left and top right of the graph area are slider controls that will respectively scale the graph horizontally and vertically.