 WhatRoute HelpWhatRoute Help
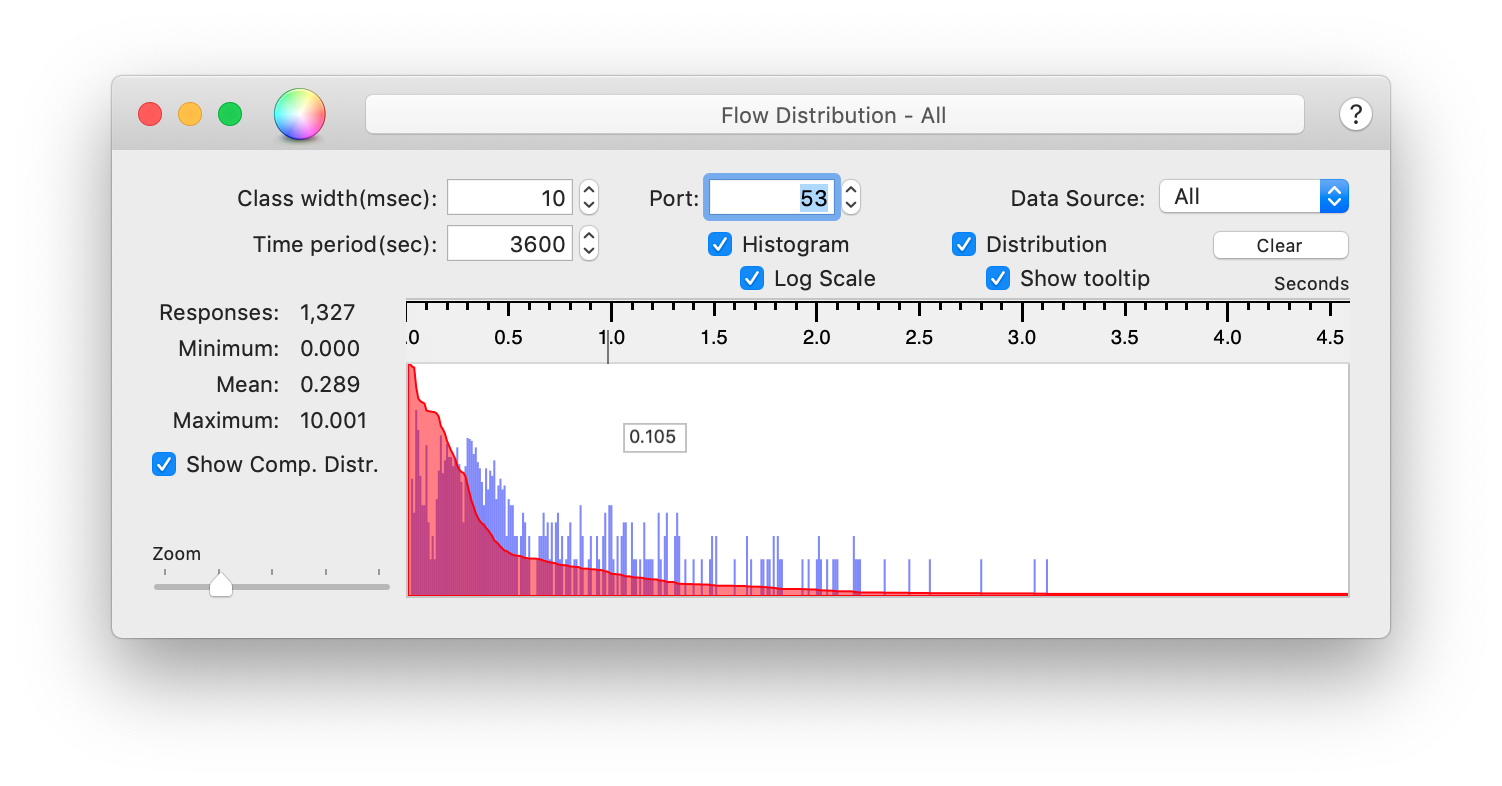
The Flow Distribution window shows the reponse time of transactions on the specified port. Primarily this is intended to check the performance of DNS servers and the port defaults to 53 for that reason.
Flows that are captured by the Flow Monitor windows are relayed to the Flow Distribution window for analysis. i.e. You must have a Flow Monitor running.
All time measurements displayed have units of Seconds.
The graphs are scaled (either linear or logarithmically) to completely fill the display area of the window.
 Tool
Bar
Tool
Bar
Colour wheel Adjust colours of the Histogram and
Distribution.
Title Show the selected interface.
Help Button Display this page.
Data Source
Select the interface that is to be monitored.
All forwards flows from all interfaces to this window for
analysis, otherwise only flows to/from the selected interface will be
analysed.
Class width
Responses are assigned to classes to form the histogram. The class width
can have a dramatic effect on the appearance of the histogram and this
value should be modified with care.
Default: 50 msecs
Range: 1 - 1000 msecs
Port
The tcp/udp port that is monitored.
You can monitor any port in the range 1 - 65535. See the note above re
the DNS port (53).
Time period
Captured flows will be expired after the time period has elapsed and
this histogram updated to reflect the change.
Default: 300 secs
Range: 1 - 86400 seconds
Histogram
Display a histogram of all responses, classfied according the the
Class Width value. Vertical scaling may be either logarithmic
or linear. The histogram is scaled so that the maximum class value will
be the height of the display.
Distribution
Display the cumulative probability distribution, scaled to fit the
height of the display area.
Log Scale
If checked, the Histogram is scaled logarithmically. This distorts the
values visually, but enables greater detail to be viewed than is visible
with a linear display.
Default: checked
Clear
Discard all captured data and clear the display.
Show Comp. Distr.
Show the complement of the cumulative probability distribution function
where: CCPF(i) = 1.0 - CPF(i)
Zoom
Adjust the scale of the time axis.
Default: 1
Range: 0.5 to 8